Click on the ‘Edit’ icon.
The number of columns will be two for the bar graphs.
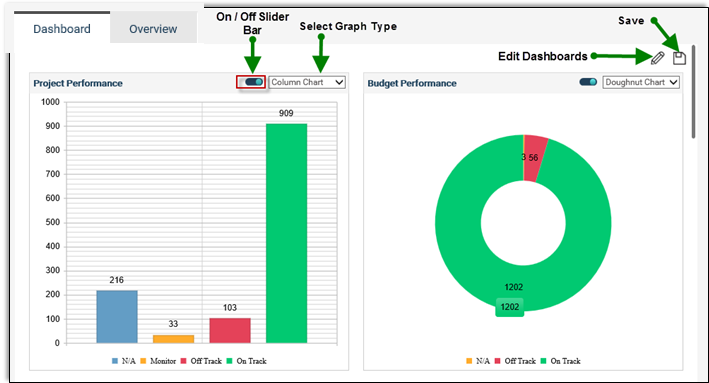
For each widget, ‘On/Off Slider bar’ is available. Making it ‘Off’ will hide the particular widget from the dashboard. All widgets will be shown by default.
Select the graph type. You can view the graph either as a ‘Bar Chart’ or ‘Doughnut Chart’. By default, all graphs will be shown as doughnut charts except for the ‘Project Progress’ graph which will be shown as a bar chart.
Copyright © 2014-2015 CAMMS Online Help. All rights reserved.
Last revised: July 26, 2017